Performance in 2019
GRI 201-1
The set of results evidences OdontoPrev’s unique strategic positioning, with a specialized operation in each client’s segment, optimizing the capture of growth opportunities and value creation.
Net revenue grew 12.8% in 2019, from R$1,592 million in 2018 to R$1,795 million in 2019, with an average ticket of R$21.13 per beneficiary/month, compared to R$20.43 in 2018.
Evolution of Net Revenue (R$ million)

The number of OdontoPrev’s beneficiaries reached 7,399,638 in 2019. The portfolio was composed of corporate clients (71%) and the remaining 29%, SMEs, and individual plans.
The cost of services accounted for 44.5% of revenue for the year, versus 44.1% in 2018. Selling and administrative expenses represented 26.6% of revenue in 2019, compared to 25.8% in the previous year.
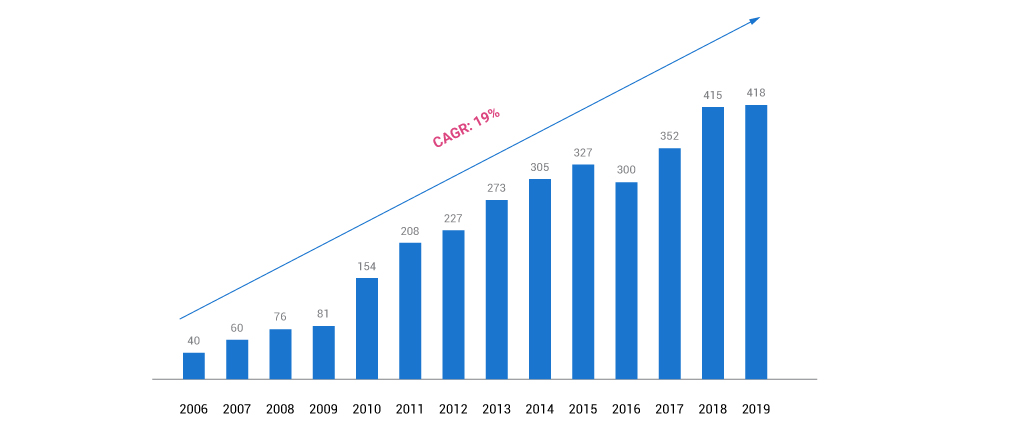
Operating cash generation, measured by adjusted EBITDA, totaled R$418 million in 2019, 1% higher than in 2018, with a margin of 23.3%, lower than the 26.1% recorded in 2018.
Adjusted EBITDA (R$ million)

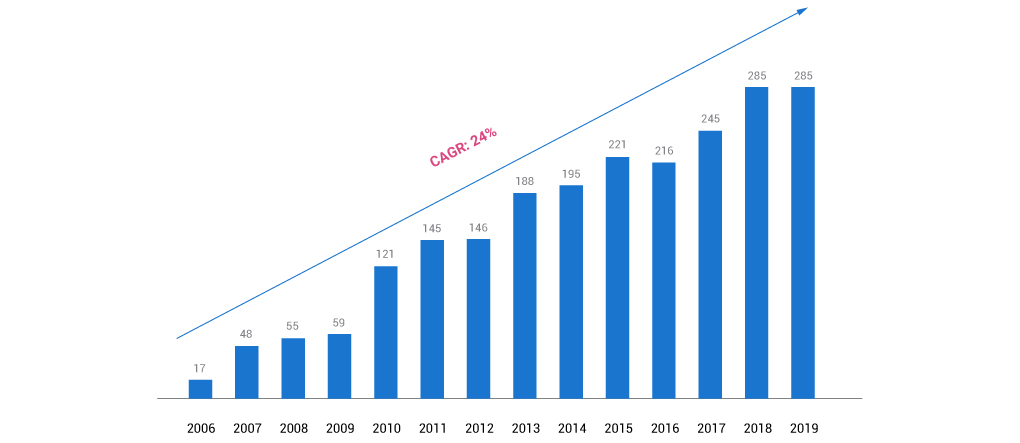
Net income totaled R$285 million, in line with 2018, and the Company ended 2019 with net cash of R$560 million, and zero debt.
Net Income (R$ million)

Return to shareholders
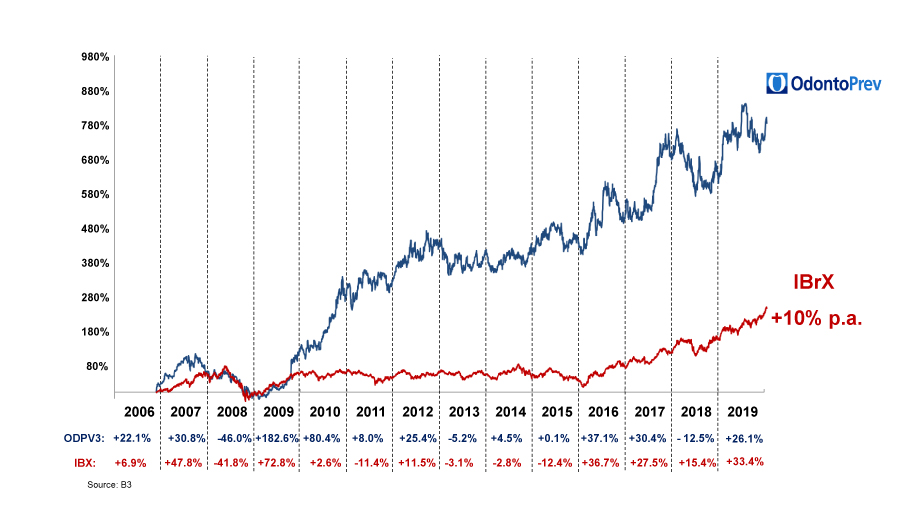
In 2019, OdontoPrev completed 13 years of its IPO on B3’s Novo Mercado, and at the end of 2019, reached a market capitalization of R$9.0 billion. Total return to shareholders since the IPO accumulates 824%, versus 257% of IBX-100.

Value-Added Statement (VAS)
The VAS aims at evidencing the wealth generated by OdontoPrev and its distribution to the company’s segments, represented by shareholders, employees, financial institutions, and government. The value distribution took place as follows:
| (Reais thousands) | |||
|---|---|---|---|
| Code | Account Description | 01/01/2018 to 12/31/2018 | 01/01/2019 to 12/31/2019 |
| 7.01 | Revenue | 1,543,530 | 1,764,092 |
| 7.01.01 | Sales of goods, products and services | 1,600,167 | 1,842,530 |
| 7.01.04 | Provision/reversal of doubtful accounts | -56,637 | -78,438 |
| 7.02 | Inputs acquired from third parties | -959,567 | -1,147,633 |
| 7.02.01 | Costs of products, goods, services sold | -669,569 | -776,457 |
| 7.02.02 | Supplies, energy, outsourced services and others | -20,457 | -21,000 |
| 7.02.04 | Others | -269,541 | -350,176 |
| 7.02.04.01 | Other operating income (expenses) | -1,853 | -3.849 |
| 7.02.04.02 | Selling expenses | -167,077 | -201,072 |
| 7.02.04.03 | Administrative expenses | -103,348 | -140,516 |
| 7.02.04.04 | Variation in provision for events/losses occurred and not notified (IBNR) | -969 | -12,077 |
| 7.03 | Gross value added | 583,963 | -616,459 |
| 7.04 | Retentions | -13,805 | -22,527 |
| 7.04.01 | Depreciation, amortization and depletion | -13,805 | -19,211 |
| 7.04.02 | Others | 0 | -3,316 |
| 7.04.02.01 | Right of use amortization (CPC 06 (R2)/IFRS 16) | 0 | -3,316 |
| 7.05 | Value added received, net produced | 570,158 | 593,932 |
| 7.06 | Value added received in transfer | 49,422 | 40,047 |
| 7.06.01 | Equity accounting | 17,44 | 8,129 |
| 7.06.02 | Financial income | 31,918 | 31,918 |
| 7.07 | Total value added to distribute | 619,58 | 633,979 |
| 7.08 | Distribution of value added | 619,58 | 633,979 |
| 7.08.01 | Personnel | 89,266 | 116,497 |
| 7.08.01.01 | Direct compensation | 65,982 | 89,802 |
| 7.08.01.02 | Benefits | 18,479 | 20,754 |
| 7.08.01.03 | F.G.T.S. | 4,805 | 5,941 |
| 7.08.02 | Taxes, fees and contributions | 224,185 | 215,3 |
| 7.08.02.01 | Federal | 186,961 | 200,807 |
| 7.08.02.02 | State | 44 | 43 |
| 7.08.02.03 | Municipal | 37,18 | 14,45 |
| 7.08.03 | Debt capital | 12,774 | 14,664 |
| 7.08.03.02 | Rentals | 5,664 | 2,053 |
| 7.08.03.03 | Other | 7,11 | 12,611 |
| 7.08.03.03.01 | Financial expenses | 7,11 | 12,611 |
| 7.08.04 | Equity capital | 284,793 | 284,763 |
| 7.08.04.01 | Interest on equity | 59,627 | 62,556 |
| 7.08.04.02 | Dividends | 103,131 | 136,779 |
| 7.08.04.03 | Retained earnings/accumulated losses for the period | 122,035 | 85,428 |
| 7.08.05 | Other | 8,562 | 2,755 |
| 7.08.05.01 | Stock Option Grant | 8,562 | 2,755 |


